Proprietary AI products as well as product development and R&D services for non-standard and science intensive tasks.
Contact Us
Medical image computing and biomedical signal analysis
A survey.
Get in Touch
SEE MORE AND SUBSCRIBE:
Application of methods for digital processing of images and signals
has become widespread in medicine. This progress is based on two aspects.
First is the rapid development of medical diagnostic equipment: computed tomography (CT),
single-photon emission computed tomography (SPECT), magnetic resonance imaging (MRI),
diverse types of ultrasound and x-ray methods. Secondly is
the rapid development of computer technology and mathematical methods of image analysis,
machine learning and computer vision.
In recent years, the explosive development of deep learning methods,
data analysis methods and data processing systems,
for example, big data - all this has led to the fact that the solution
of biomedical tasks for which it was previously impossible now can be automated.
We create systems for processing single-, multichannel signals,
and medical images: two dimensional (2D), three dimensional (3D), and video stream.
The group of biomedical signals includes: EEG, ECG, EMG, speech, temperature, pressure and so on.
Using this data, automatic analysis systems can predict in advance the onset of epileptic seizures,
fibrillation of the heart, detect hidden pathologies.
Based on several data sources, it is possible to automatically evaluate the psychoemotional state
of a person with high accuracy.
Imaging methods are: computed tomography (CT), magnetic resonance imaging (MRI),
single-photon emission, computed tomography (SPECT), radiography and images
of the optical or infrared spectrum obtained with conventional photo and video cameras.
All of the opportunities of using systems for automatic analysis of such data can be hardly enumerated.
Some of them are: diagnosis and detection of lesions of internal and external organs,
classification and measurement of objects on histological images or, for example,
automatic segmentation and classification of damaged teeth on X-ray images.
Altogether, the processing of medical images and biomedical signals
using computer vision techniques and deep machine learning can be applied to:
automatic detection of events;
objects detection and measurement of their parameters;
predictions of events: based on the patient's current signal
or the accumulated data set for different patients;
detection of anomalies in tissues or organ functions, detection of pathologies and onset of diseases;
classification of samples;
data rectification and enhancement;
delineation of borders and objects not visible to the naked eye;
search for the object by its example;
revealing and research of the characteristics of objects and signals;
emotion analysis, detection of psycho-emotional state
(affective computing).
In the following sections we will give examples of state-of-the-art on different directions of computer analysis
of medical images and biomedical signals.
Ultrasound analysis
Analysis of a fetal heart ultrasound videos
Interpretation of ultrasound videos of the fetal heart is crucial
for the antenatal diagnosis of congenital heart disease (CHD).
Automated image analysis techniques could make
an important contribution towards improving CHD detection rates.
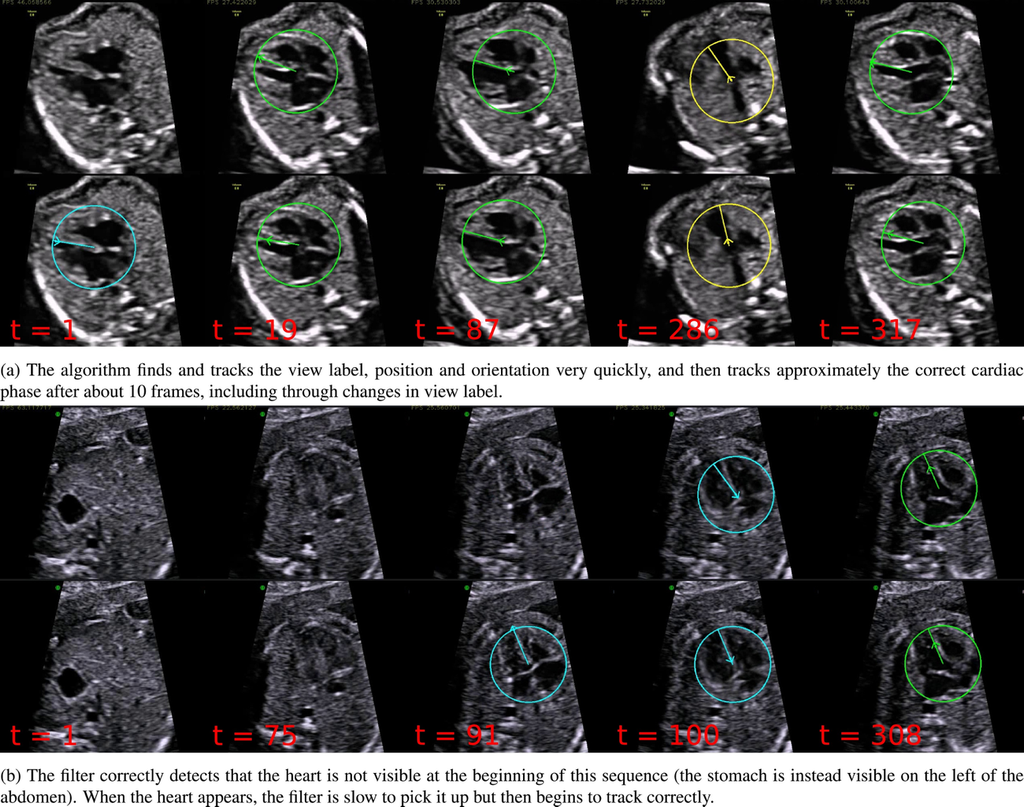
The work being cited presents a framework for tracking the key variables that describe
the content of each frame of freehand 2D ultrasound scanning videos of the healthy fetal heart.
This represents an important first step towards developing tools that can assist
with CHD detection in abnormal cases.
The system is trained to predict the visibility,
location and orientation of the fetal heart in the image, and the viewing plane
label from each frame.
Results of the algorithm on two example sequences (in each sequence the top row shows the prediction, and the bottom row shows the ground truth). Times shown are frame numbers. Additionally, the position of the arrow head represents the position in the cardiac cycle (pointing outwards represents systole and pointing inwards represents diastole).
Source: “Automated annotation and quantitative description of ultrasound videos of the fetal heart”, 2016, Christopher P.Bridge et al.
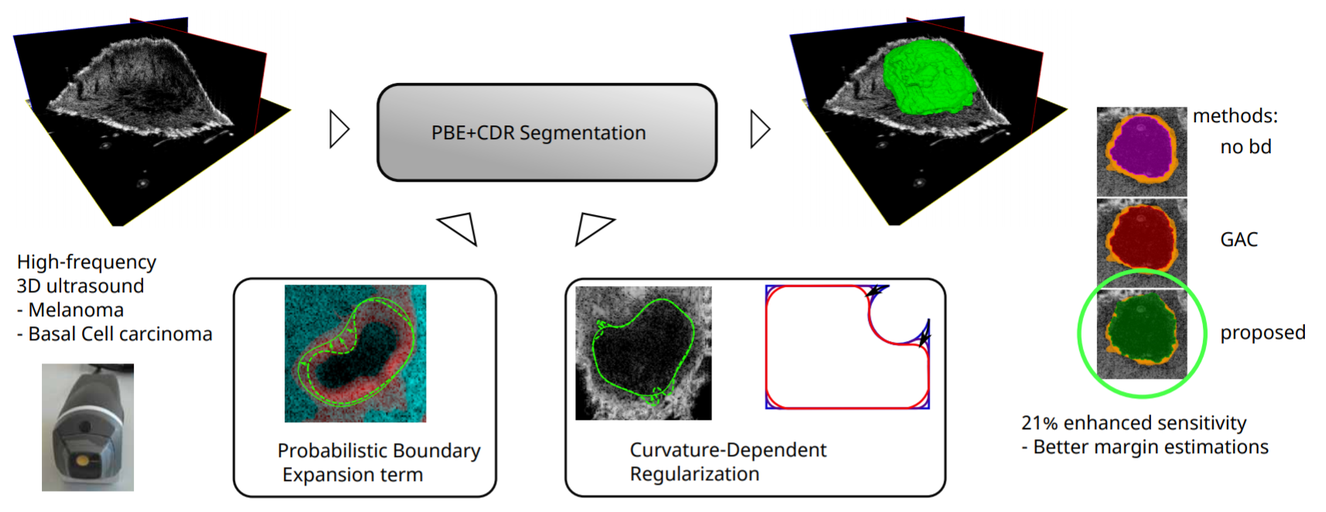
3D ultrasound analysis for skin cancer localization
In this work a segmentation algorithm for skin lesions in 3D high frequency ultrasound images is presented.
The segmentation is done on melanoma and Basal-cell carcinoma tumors,
the most common skin cancer types, and could be used for diagnosis and surgical excision planning
in a clinical context.
Source:
“Improved boundary segmentation of skin lesions in high-frequency 3D ultrasound”, 2017, B. Sciolla et al.
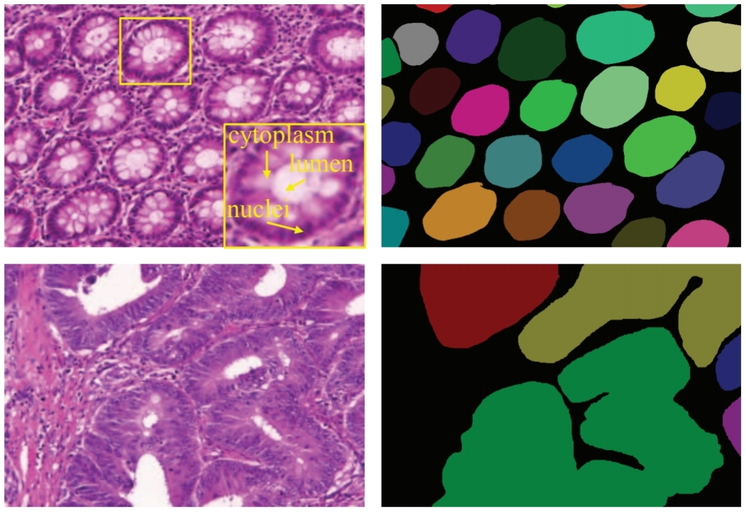
Analysis of histological images in quantitative histology
Examples of gland segmentation in benign (top row) and malignant (bottom row) cases.
From left to right columns show the original images (stained with hematoxylin and eosin) and annotations
by pathologists (individual objects are denoted by different colors), respectively.
Source: “DCAN: Deep contour-aware networks for object instance segmentation from histology images”, 2016, Hao Chen et al.
The morphology of glands has been used routinely by pathologists to assess the malignancy degree
of adenocarcinomas. Accurate segmentation of glands from histology images is a crucial step
to obtain reliable morphological statistics for quantitative diagnosis.
X-ray image analysis
Dental radiography analysis
Dental radiography analysis plays an important role in clinical diagnosis,
treatment and surgery as radiographs can be used to find hidden dental structures,
malignant or benign masses, bone loss and cavities.
During diagnosis and treatment procedures such as root canal treatment, caries diagnosis,
diagnosis and treatment planning of orthodontic patients, dental radiography analysis is mandatory.
Сaries detection and dental anatomy analysis are important
in clinical diagnosis and treatment. Dental caries is a transmissible bacterial disease
of the teeth that would destructs the structure of teeth, and the dentist
has approached diagnosing and treating dental caries based mostly on radiographs.
While dental caries is a disease process, the term is routinely used to describe radiographic radiolucencies.
Radiographic examination can improve the detection and diagnosis of the dental caries.
In the clinical practice, caries lesions have traditionally been diagnosed
by visual inspection in combination with radiography.
Therefore, automated caries detection systems with high reproducibility
and accuracy would be welcomed in clinicians’ search for more objective caries diagnostic methods.
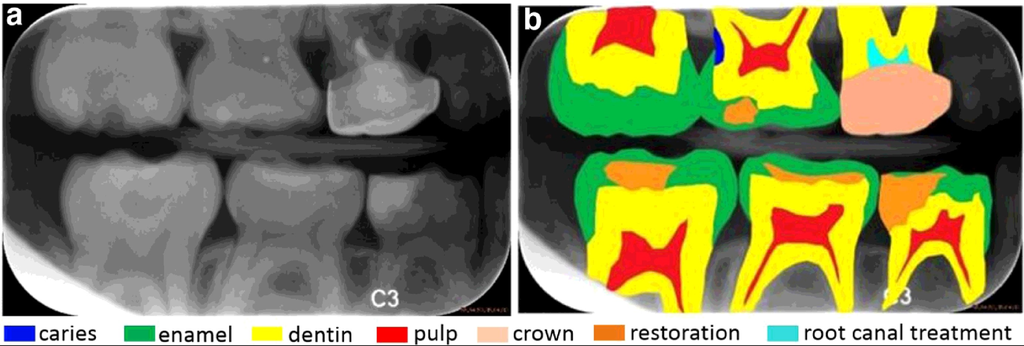
Bitewing radiographs: (a) a raw image with (b) seven dental structures highlighted, including (1) caries with blue color, (2) enamel with green color, (3) dentin with yellow color, (4) pulp with red color, (5) crown with skin color, (6) restoration with orange color and (7) root canal treatment with cyan color.
Source: “A benchmark for comparison of dental radiography analysis algorithms”, 2016, Ching-WeiWang, et al.
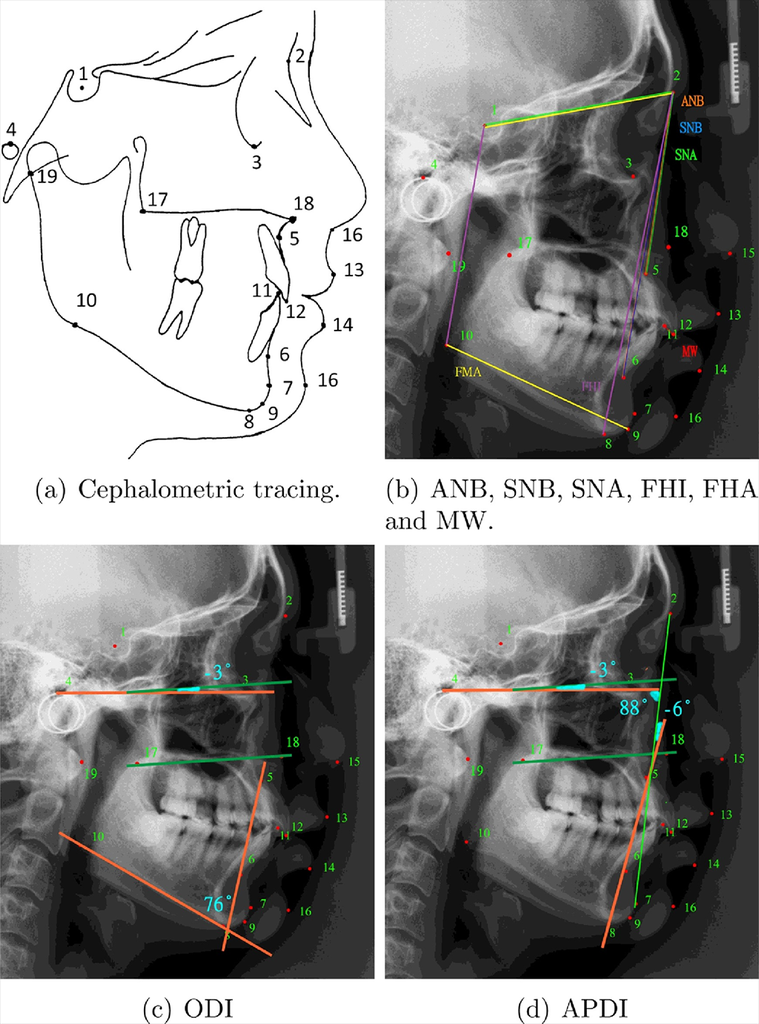
Cephalometric analysis for the clinical diagnosis of anatomical abnormalities
Cephalometric tracing clinical measurements for classification of anatomical abnormalities.
Source:“A benchmark for comparison of dental radiography analysis algorithms”, 2016, Ching-WeiWang, et al.
Cephalometric analysis describes the interpretation of patients’ bony, dental and soft tissue structures and provides all images for the orthodontic analysis and treatment planning. However, in clinical practice, manual tracing of anatomical structures (as shown in Fig. 1) is commonly conducted during treatment planning. This procedure is time consuming and subjective. Automated landmark detection for diagnosis and orthodontic treatment of cephalometry could be the solution to facilitate these issues.
Apart from anatomical landmark detection in cephalometric images,
a new classification task for the clinical diagnosis of anatomical abnormalities
using these landmarks is being solved.
Segmentation of MRI images
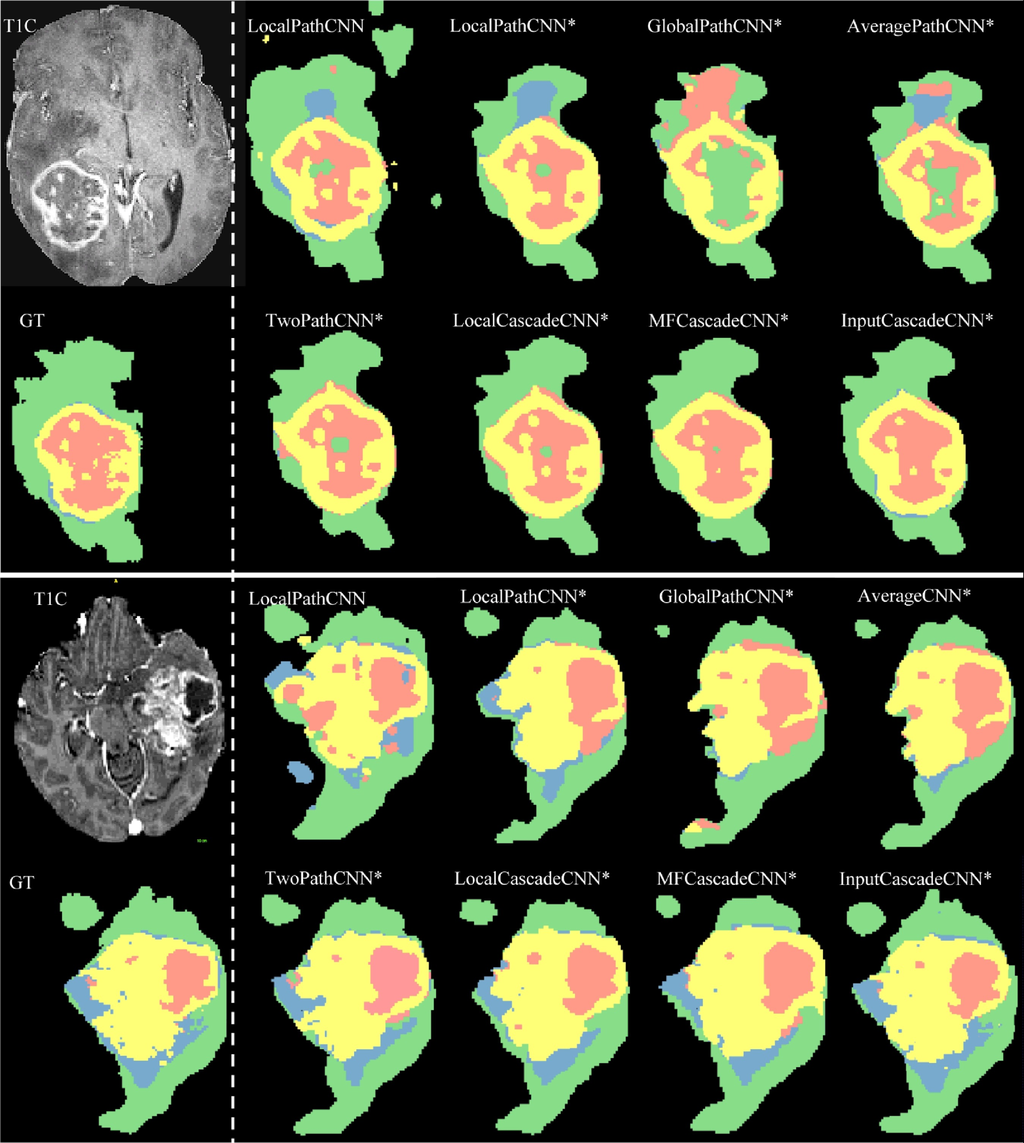
Diagnosis and detection of lesions on images of brain MRI
Magnetic resonance imaging (MRI) provides the researcher
with detailed images of the brain and is one of the most common tests used
to diagnose brain tumors. The method allows to obtain three-dimensional images
of high quality and resolution, which are built on a set of consecutive two-dimensional sections.
Segmentation of MRI images of the brain to anatomical structures is an important step
in the diagnostics, growth rate prediction and treatment planning.
Algorithm results from the Axial view.
In the upper left corner is the analyzed image.
In the lower left corner - the results of manual markup.
The rest of the figure shows the results of automatic markup and classification of brain areas.
The color codes are as follows:
edema, enhanced tumor, necrosis, non-enhanced tumor.
Source: “Brain tumor segmentation with Deep Neural Networks”, 2016, Mohammad Havaei
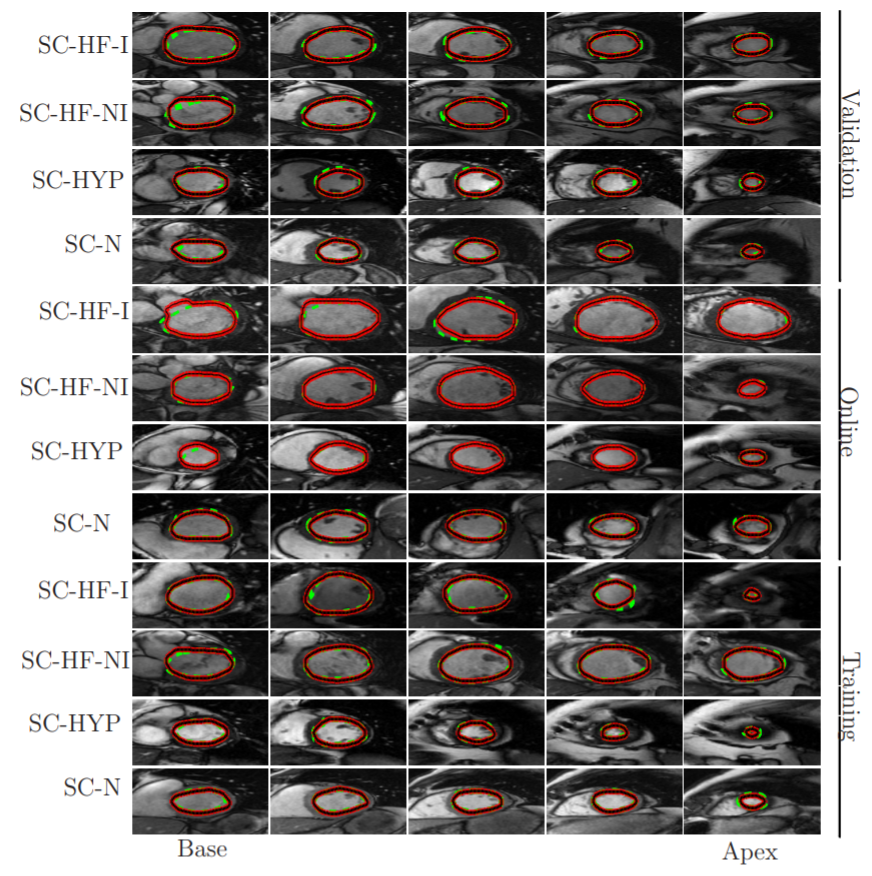
Cardiac magnetic resonance imaging
Segmentation of the left ventricle (LV) from cardiac magnetic resonance imaging (MRI) datasets is an essential step for calculation of clinical indices such as ventricular volume and ejection fraction.
Automatic (red-black) and manual (dashed green) segmentation of LV in the base (left),
mid-ventricular (middle) and the apex (right) slices for multiple cases of the MICCAI database (Radau et al., 2009).
Each row corresponds to one patient, ischemic heart failure (SC-HF-I),
non-ischemic heart failure (SC-HF-NI), LV hypertrphies (SCHYP) and normal (SC-N).
Source:“A Combined Deep-Learning and Deformable-Model Approach to Fully Automatic Segmentation of the Left Ventricle in Cardiac MRI”, 2016, M. R. Avendi et al.
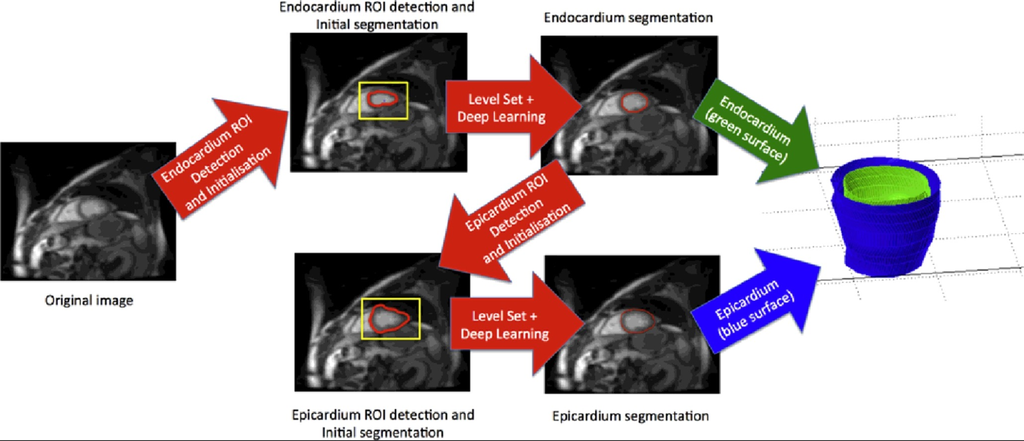
A method that combines deep learning and level set for the automated segmentation of the left ventricle of the heart from cardiac cine magnetic resonance (MR) data.
Source: “Combining deep learning and level set for the automated segmentation of the left ventricle of the heart from cardiac cine magnetic resonance”, 2016, Tuan Anh Ngo et al.
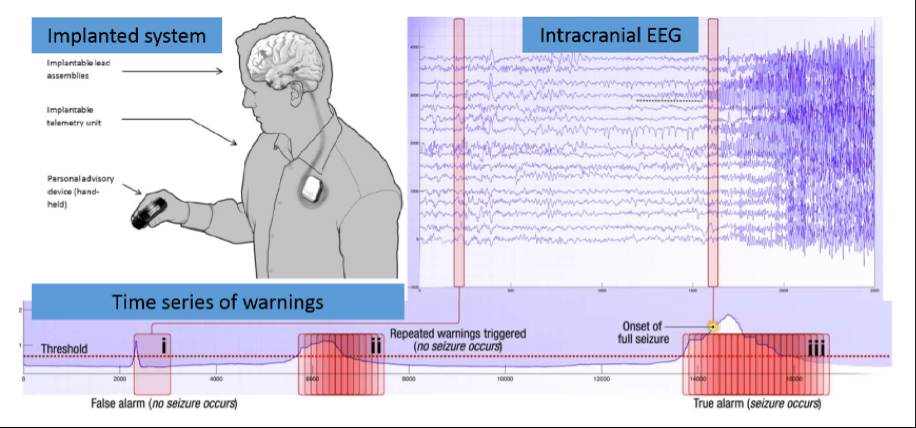
Epilepsy afflicts almost 1% of the world's population and is characterized by the occurrence of spontaneous seizures.
For many patients, anticonvulsant drugs can be prescribed at sufficiently high doses to prevent seizures,
but patients often suffer from side effects. For 20-40% of patients with epilepsy drugs are not effective.
Even after the surgical removal of epilepsy, many patients continue to experience spontaneous convulsions.
Despite the fact that seizures occur infrequently, patients with epilepsy experience constant anxiety due to the possibility of an attack.
Epileptic seizure prediction systems can help patients with epilepsy lead a more normal life.
For efficient operation of the EEG-based forecasting system should reliably identify periods
of increased probability occurrence of seizures.
This will lead to devices created, designed to warn patients about future attacks.
Patients could avoid potentially dangerous actions,
such as driving or swimming, and use medicines only if, when necessary, to prevent impending seizures,
reducing overall side effects.
Analysis of images taken with commodity photo and video cameras
This is our eye tracking and emotion recognition system that analyzes eye movements
and facial expressions using a standard camera.
We have created it for researchers at Neurodata Lab. It is called the Eye Catcher.
Eye Catcher is an eye tracking and emotion recognition app for measuring eye movements and gaze direction
of people in everyday life, unconstrained environments.
It detects emotions as a mix of 6 basic expressions: happiness, sadness, surprise, anger, disgust, fear.
Eye Catcher works with videos shot by commodity cameras, no special hardware or calibration needed.